Calibration & uncertainty
A monitoring system should know when it doesn’t know. This page reports how well each model’s predicted probabilities match observed frequencies, out-of-fold, and whether letting the model abstain on low-confidence points helps.
| Model | Brier score (lower is better) | n |
|---|---|---|
| gradient_boosting | 0.335 | 809 |
| logistic_regression | 0.411 | 809 |
| majority | 0.214 | 809 |
| random_forest | 0.318 | 809 |
| spectral_threshold_bsi | 0.253 | 809 |
Reliability diagram
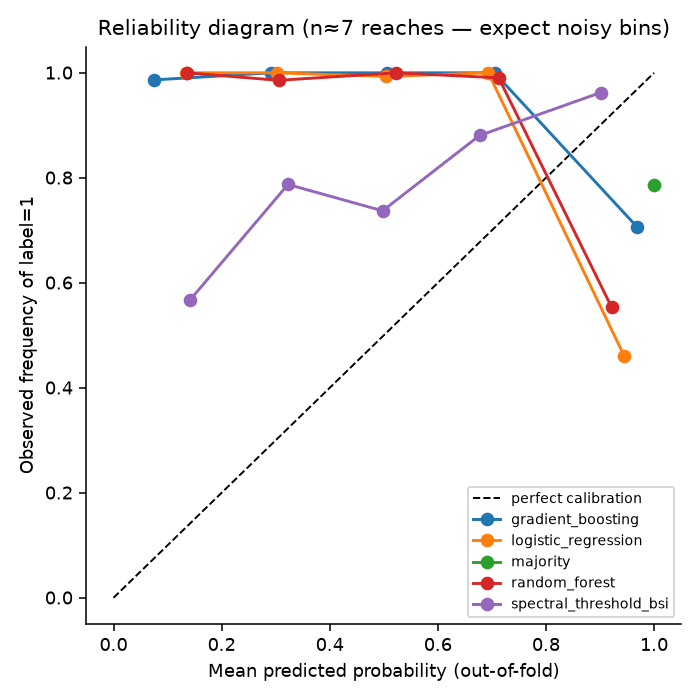
Points on the dashed line are perfectly calibrated. With n≈7 reaches, expect noisy bins.
Abstention curve
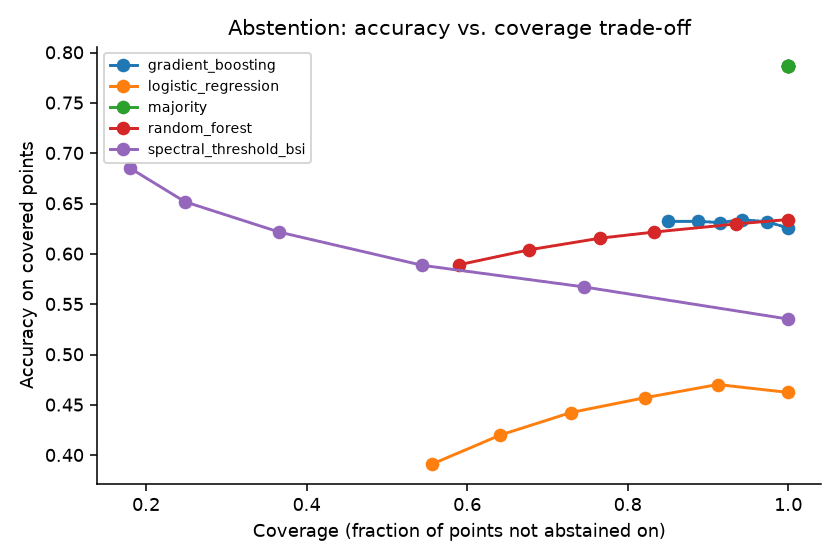
Accuracy on the points the model is confident about, as the confidence margin required to not abstain increases (coverage drops accordingly).
Is any of this robust? Bootstrap confidence intervals
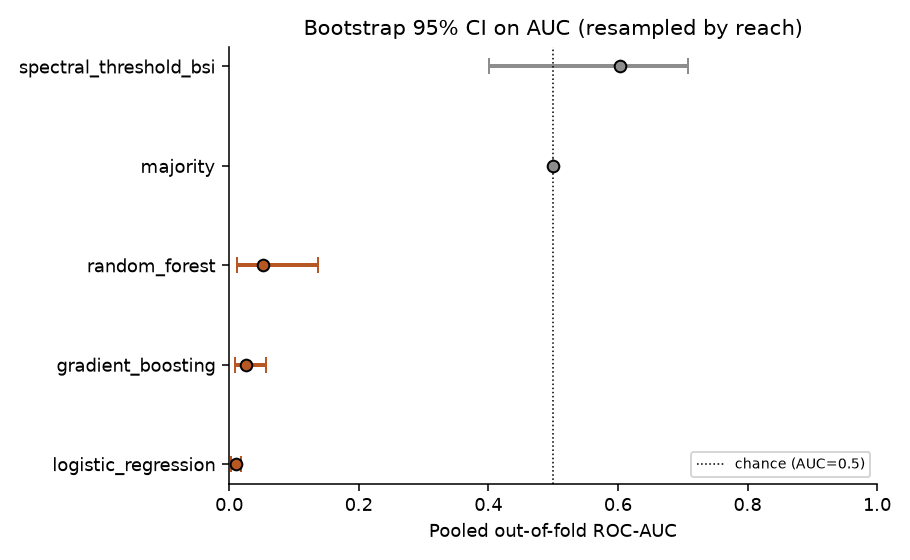
All numbers above are point estimates from one partition of 809 points into 7 reach-based folds. To see how much they’d move under a different sample of rivers, we resampled which reaches (not which points — points within a reach are correlated) contribute to the pooled AUC, 5000 times, and recomputed it each time.
| Model | Point estimate (AUC) | 95% CI (resampled by reach) | Robust? |
|---|---|---|---|
| logistic_regression | 0.010 | [0.003, 0.018] | yes — excludes 0.5 |
| gradient_boosting | 0.026 | [0.009, 0.057] | yes — excludes 0.5 |
| random_forest | 0.053 | [0.012, 0.137] | yes — excludes 0.5 |
| majority | 0.500 | [0.500, 0.500] | no — straddles 0.5 |
| spectral_threshold_bsi | 0.604 | [0.401, 0.708] | no — straddles 0.5 |
What do the misclassifications actually look like?
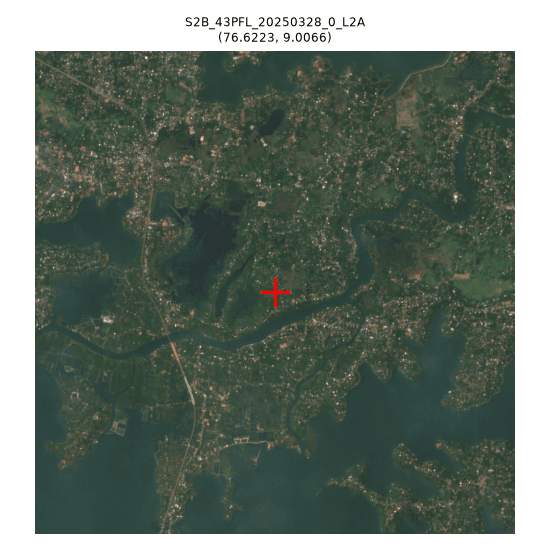
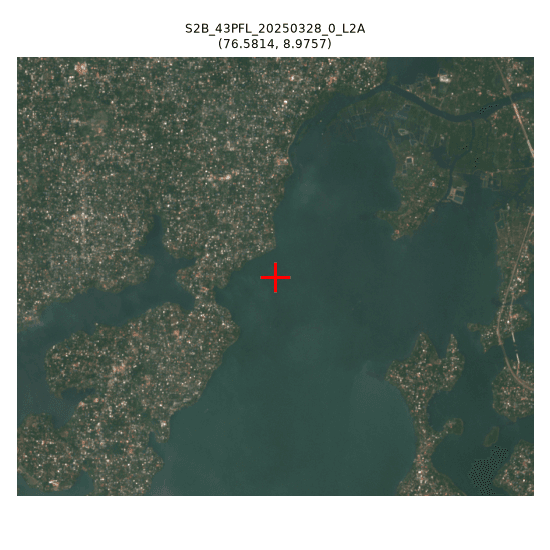
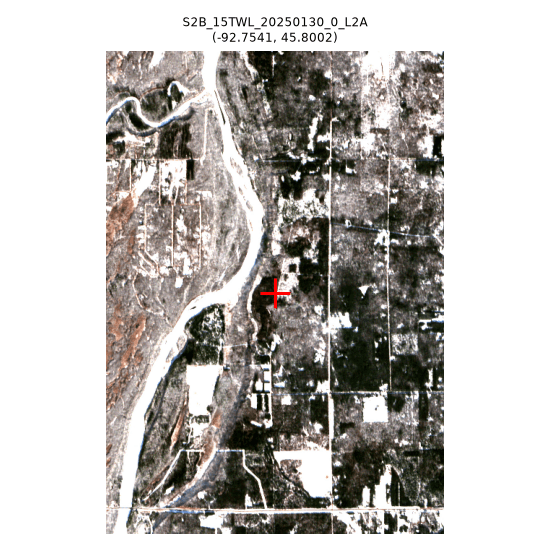
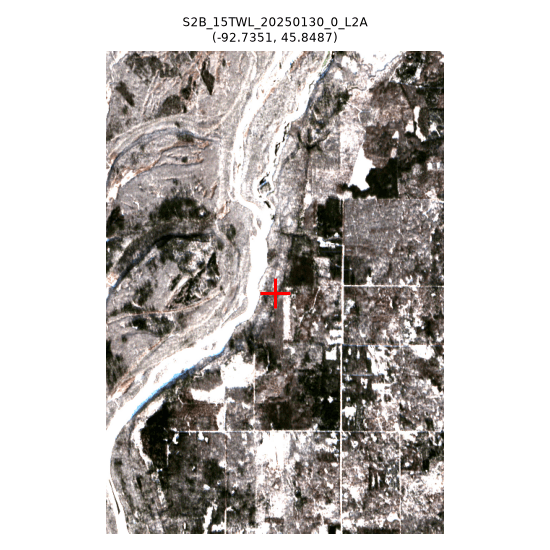
A real, single-annotator (non-expert, Level-B informal) visual spot-check of 11 true-color Sentinel-2 crops around misclassified and correctly classified points (research/failure_taxonomy.md). The red cross marks the exact sampled point. This is illustrative, not exhaustive — 11 of 809 points — and does not relabel any point.
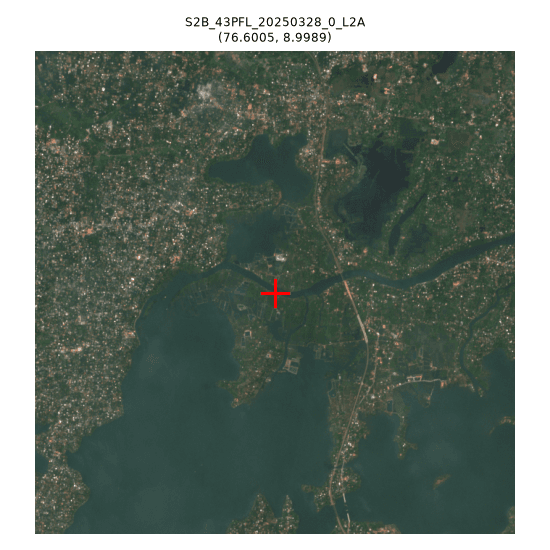
kallada_kollam_in — comparison reach — false positive
dense vegetated settlement / mixed backwater edge, no exposed sediment visible
kallada_kollam_in — comparison reach — false positive
dense vegetated settlement bisected by narrow tidal channel, no exposed sediment visible
kallada_kollam_in — comparison reach — false positive
squarely in open lagoon/backwater water, no exposed sediment visible
stcroix_grantsburg_us — comparison reach — false positive
snow-covered agricultural field, winter scene (2025-01-30) -- radiometric confound
stcroix_grantsburg_us — comparison reach — false positive
snow-covered fields adjacent to partially-frozen river, same winter scene -- radiometric confound
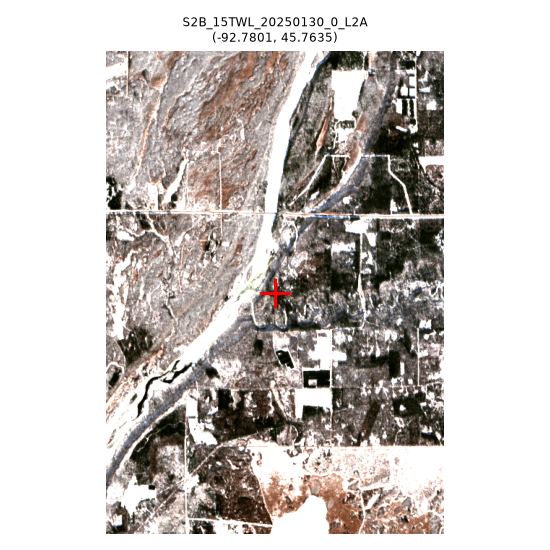
stcroix_grantsburg_us — comparison reach — false positive
snow-covered fields along river bend, same winter scene -- radiometric confound
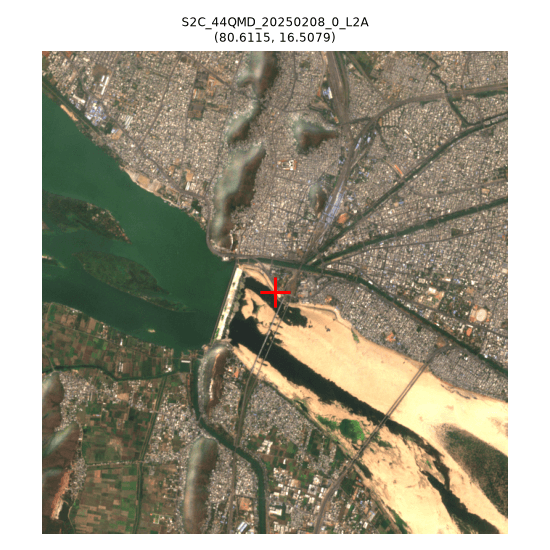
krishna_vijayawada_in — case-study reach — false negative
point sits on urban/bridge infrastructure at river edge, not on the large sandbar visible ~200m away in the same scene
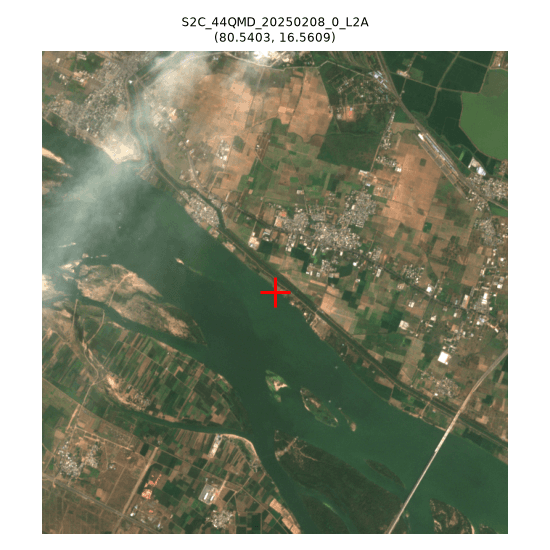
krishna_vijayawada_in — case-study reach — false negative
point sits in open river water with haze/smoke visible upper-left, no exposed sediment at this exact point
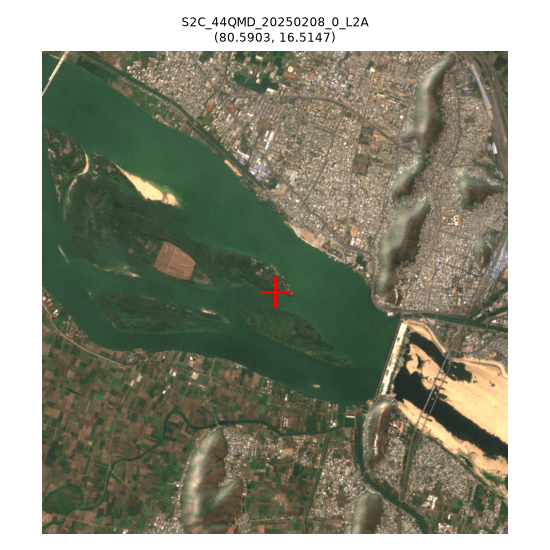
krishna_vijayawada_in — case-study reach — false negative
point sits in open water beside a vegetated river island; a real sandbar is visible elsewhere in the same crop, not at this point
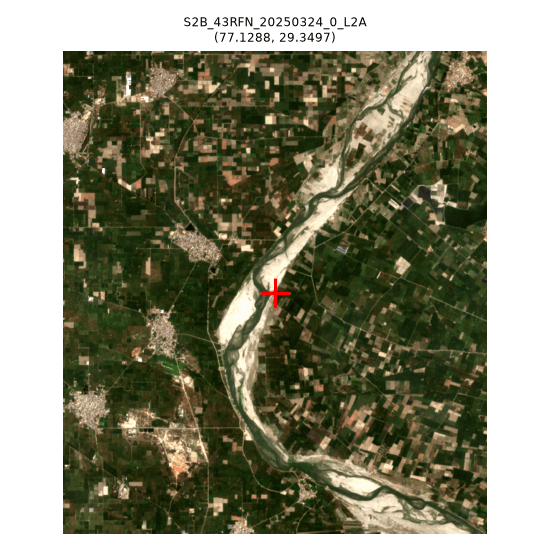
yamuna_shamli_in — case-study reach — correctly classified
point sits directly on a wide braided exposed sand channel -- genuine, visible bare-sediment signature
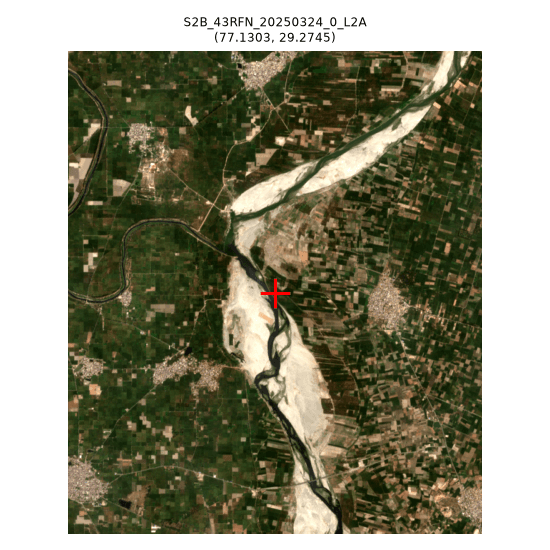
yamuna_shamli_in — case-study reach — correctly classified
point sits directly on a large bright exposed sandbar within the braided channel -- genuine, visible bare-sediment signature
Finding: no single mechanism explains every failure. Saint Croix’s false positives trace to a snow-covered winter scene (a data-quality gap); Krishna’s false negatives sit on open water rather than the reach’s visible sandbar (a label-granularity problem); Kallada’s false positives have no identified confound. See research/failure_taxonomy.md for the full writeup.
research/reviewer2.md Round 2 in the repository for the full account of this correction.